Can the visualization of data be photographic?
Andrea Polli’s practice empowers citizens to effect positive local change by harnessing the photographically inspired tools used in environmental data visualization. Using something as basic as a camera phone, she invites us all to investigate the impact of our current energy choices on the environment.
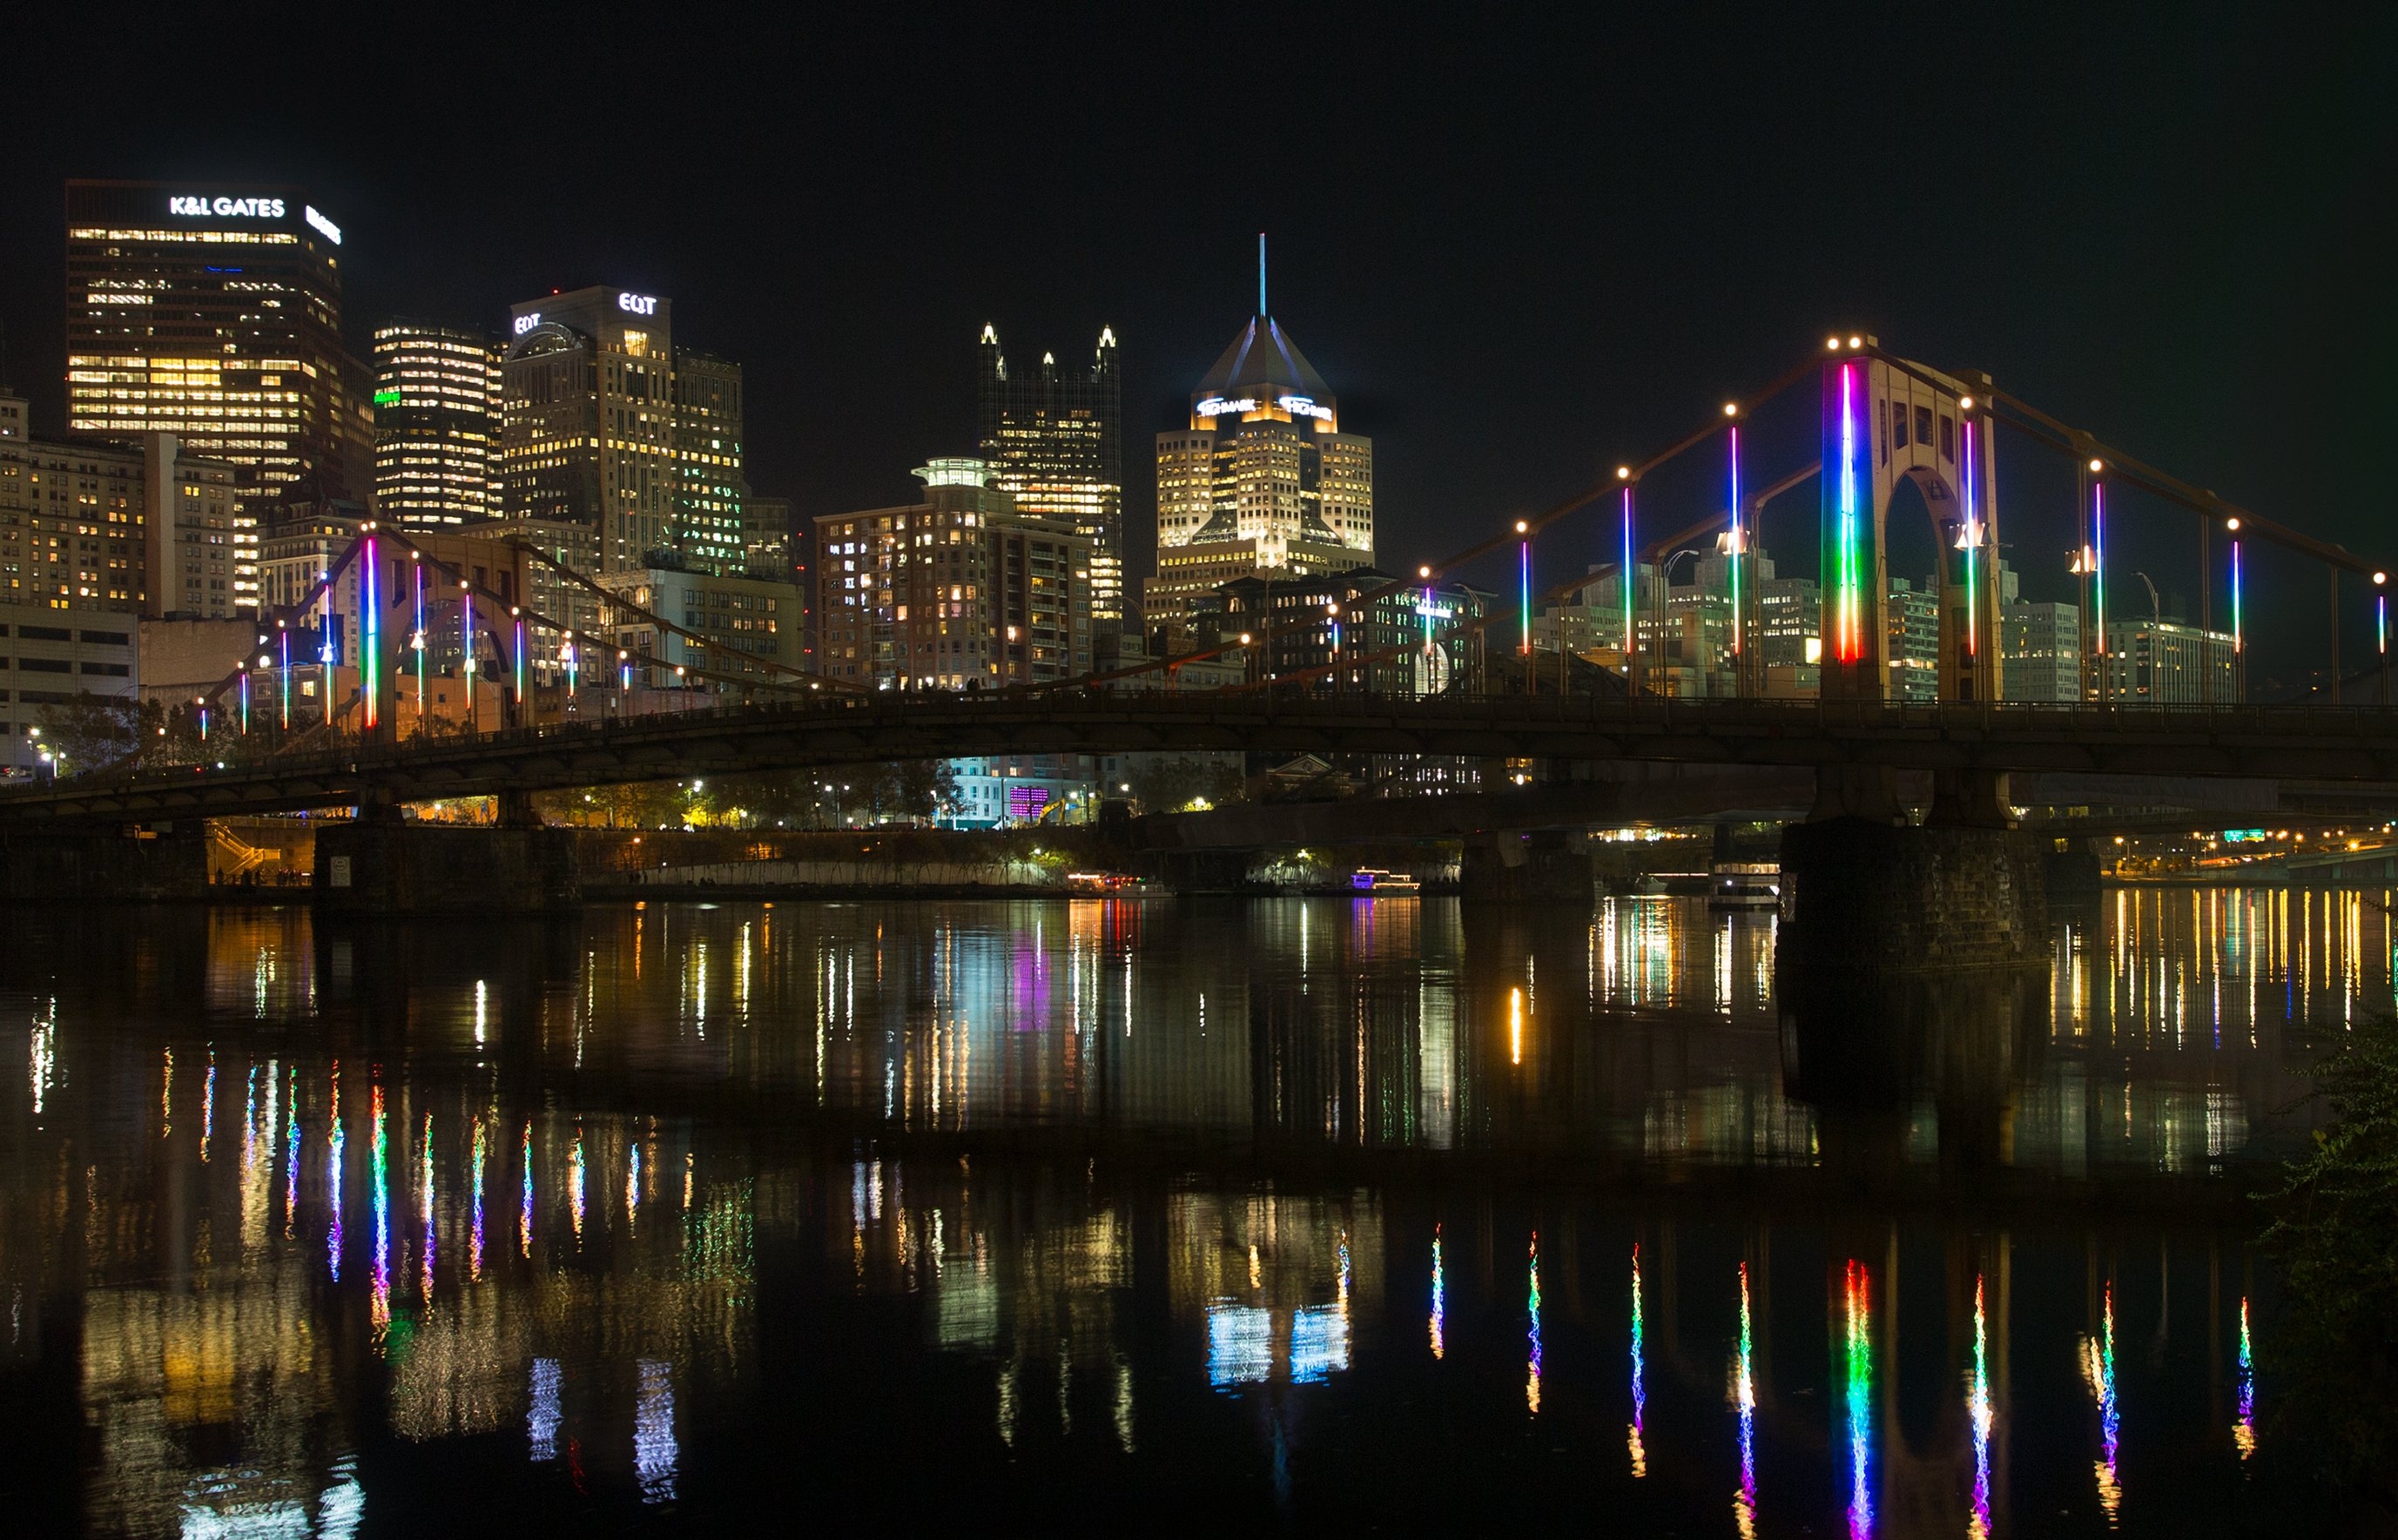
Polli launched her project at the museum in November 2016 with an artist talk Making of Energy Flow on the Rachel Carson Bridge in which she presented and contextualized her interdisciplinary practice. In January 2017, Polli led workshops, Making the Invisible Visible, An Environmental Challenge and Light, Energy, and Environmental Sensing—A Responsive Vision for Public Art that examined how we sense and experience environmental data. Participants analyzed data about light and air using tools such as the sensors on smartphones and considered how the visualization of data could be used to inspire action on pressing environmental concerns. Polli will document these workshops, as well as past and current public art projects such as Particle Falls and Energy Flow, in an artist book launching in December 2017.
Workshop: Making the Invisible Visible, An EnvironMENTAL Challenge
During this single-session public workshop, Polli shared some insights as well as her process behind the creation of Energy Flow, a large-scale light artwork and wind power nano-grid on Pittsburgh’s Rachel Carson Bridge. Polli and her team guided participants through various visualization strategies to imagine inventive, aesthetic, and informative lighting design concepts for public structures. The workshop concluded at the Rachel Carson Bridge, where Polli discussed the environmental science, artistic choices, data gathering, and computing behind the creation of the work.
Workshop: Light, Energy, and Environmental Sensing—A Responsive Vision for Public Art
This artist-led, multi-session workshop took an active approach to engaging the public with environmental issues by focusing on the Bellefield Boiler Plant, or “cloud factory”, located behind the museum. The plant is transitioning to hybrid energy production and is an ideal site for data collection (on pollution, energy, weather, and climate) as well as public presentation of this data through creative visualization.
The workshop began with a guided tour of the Plant. Over the course of four days, Polli and guest presenters guided participants through a design thinking “boot camp”; discussed idea generation and design solutions; explored activism and best practices for public engagement with important issues; and shared tools for effective data gathering.
Participants worked collaboratively to brainstorm, develop, and present solutions that envisioned the Plant as a site for imaginative data visualization. On the last day, each team shared their findings at a public discussion with invited respondents Dee Briggs, Lori Hepner, Alison Langmead, and Dutch MacDonald.


